About TIMS
The Transportation Injury Mapping System (TIMS) has been developed over the past ten-plus years by SafeTREC to provide quick, easy and free access to California crash data, the Statewide Integrated Traffic Records System (SWITRS), that has been geo-coded by SafeTREC to make it easy to map crashes.
Learn MoreAvailable features
TIMS currently provides 3 statewide summaries as well as 6 different crash and geospatial analysis tools that allow users to visualize and compare SWITRS data across California. Given the wide range of needs of TIMS users, different tools may be more suitable for your specific analysis than others. If you have never used TIMS before, please take a few minutes to read through the tool explanations down below in order to have the best possible experience. If you experience any technical difficulties please refer to our Help page or contact the TIMS team at tims_info@berkeley.edu.
Statewide Summary
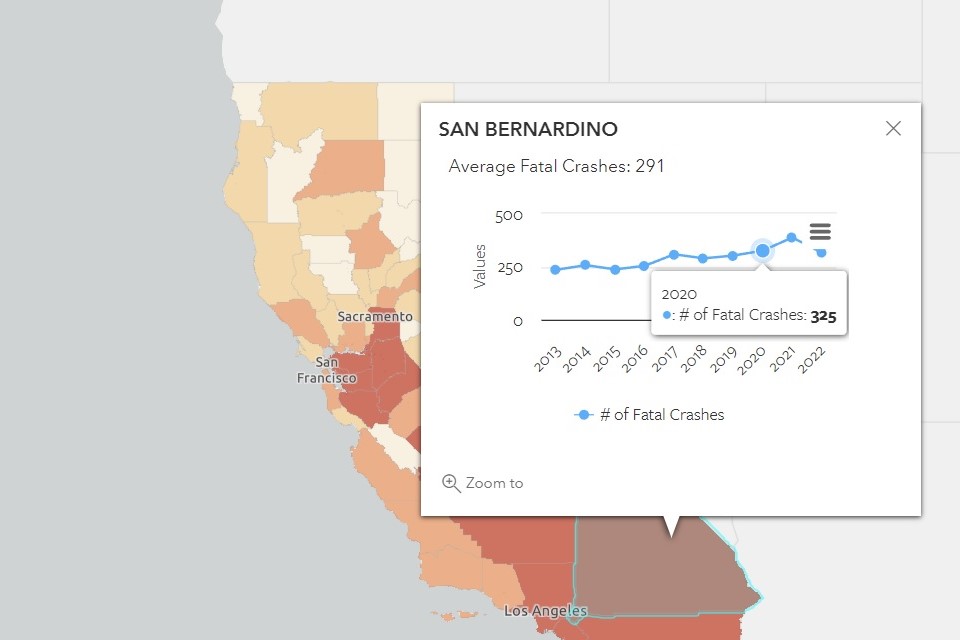
SWITRS Summary
Navigate trends of fatal and injury crashes, fatalities and injuries to pedestrians, bicyclists, motorcyclists, older adults and unrestrained vehicle passengers, fatalities and injuries related to alcohol, drugs, distracted driving, and speeding in California.
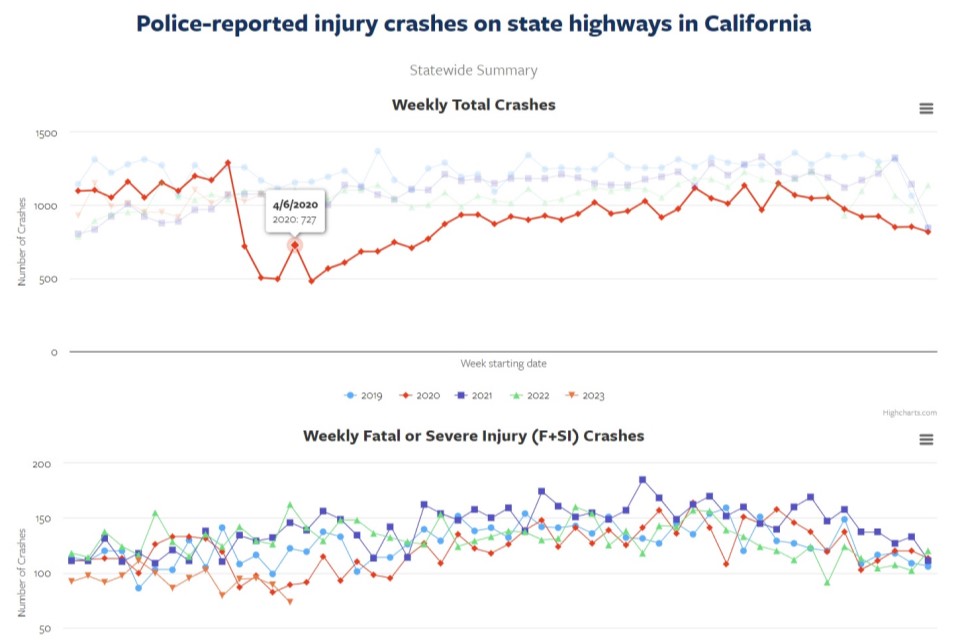
Weekly Crash Trends
Visualize weekly fatal and injury crashes on state highways in California. The tool can be used to monitor the frequency and type of crashes that occur in weekly basis for recent years.
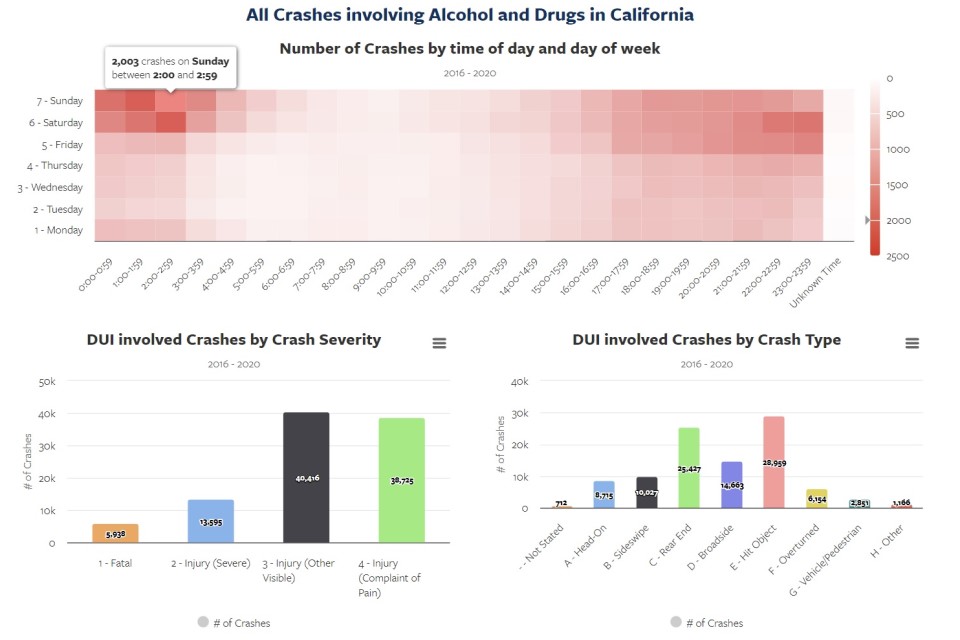
DUI Crash Summary and Map
Explore alcohol- and drug-related crash and injury trends, both statewide and in a county or city area
General SWITRS Queries & Map Tools
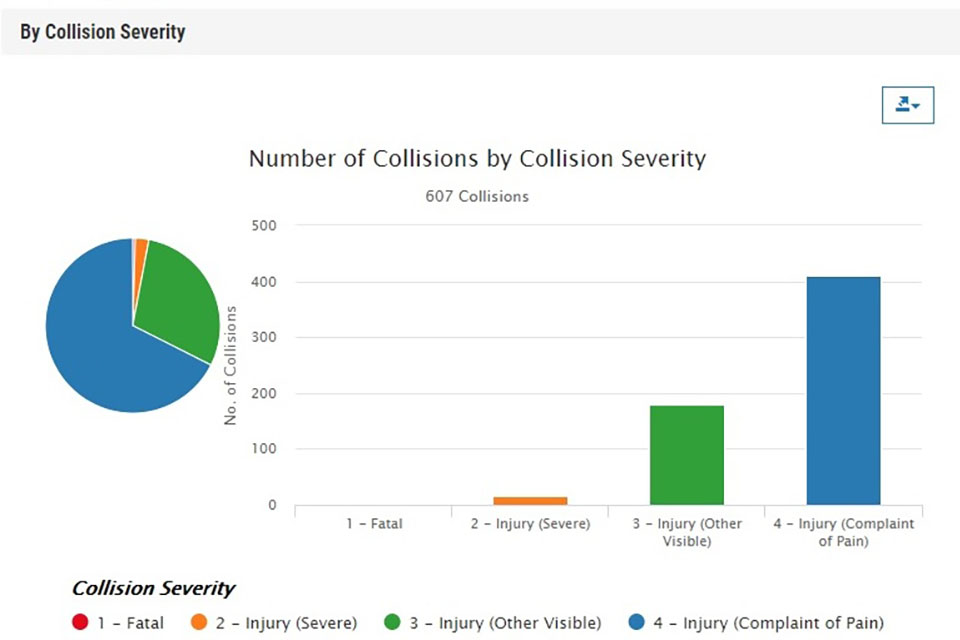
SWITRS Query & Map
A basic but powerful tool for accessing fatal or injury crashes from the California SWITRS data.
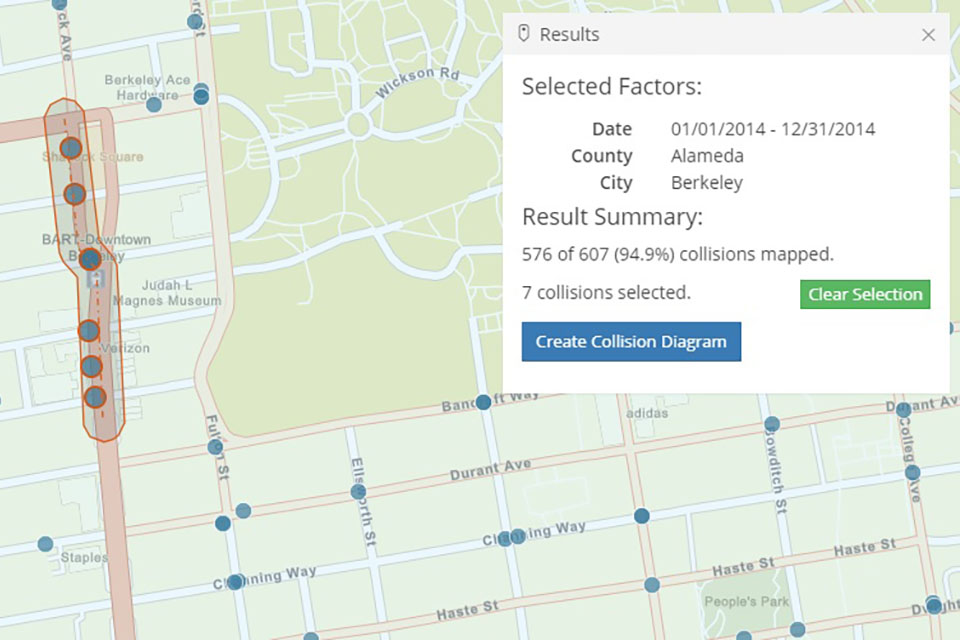
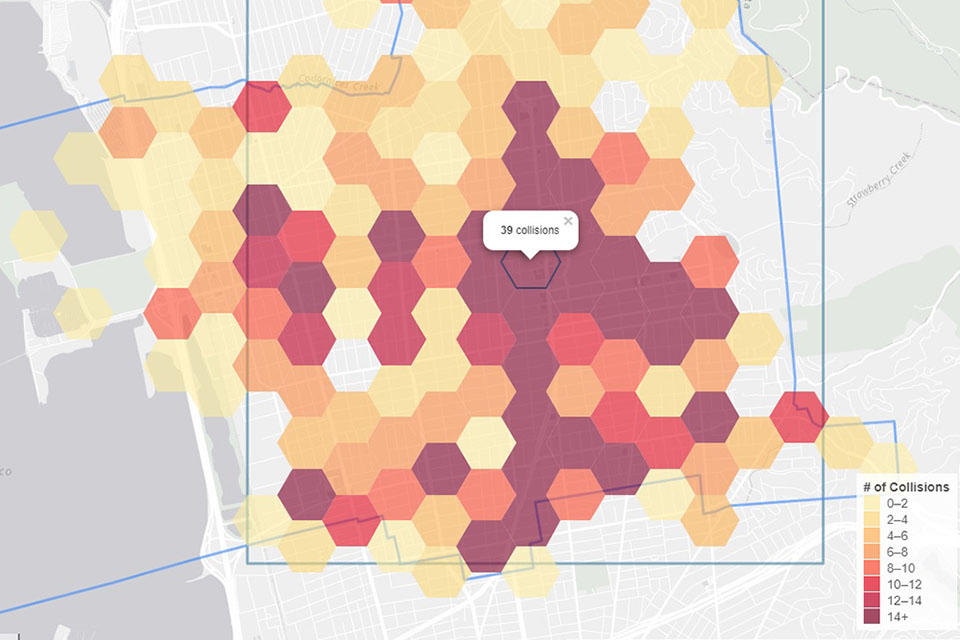
SWITRS GIS Map
A extended versition of SWITRS Query & Map based on the Geographic Information Systems (GIS) offers an interactive map with capability of multiple tasks including Rank by Intersection, Crash Diagram, etc.
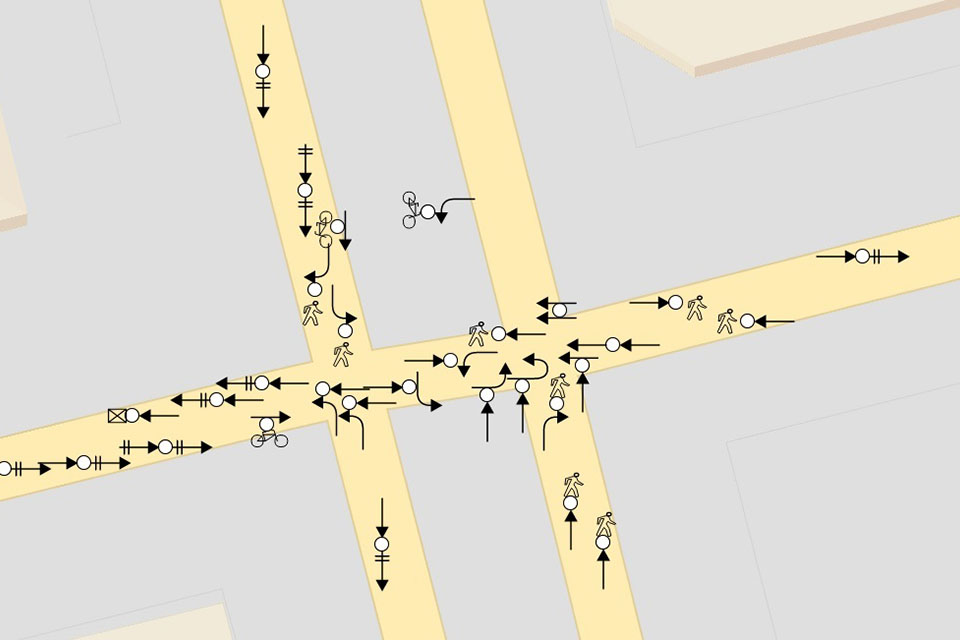
Crash Diagram
Generate an interactive crash diagram on the fly. The Crash Diagram is accessible through SWITRS GIS Map.
Still not sure where to start ?
Try the SWITRS Query & Map tool
Program or Area Specific Tools
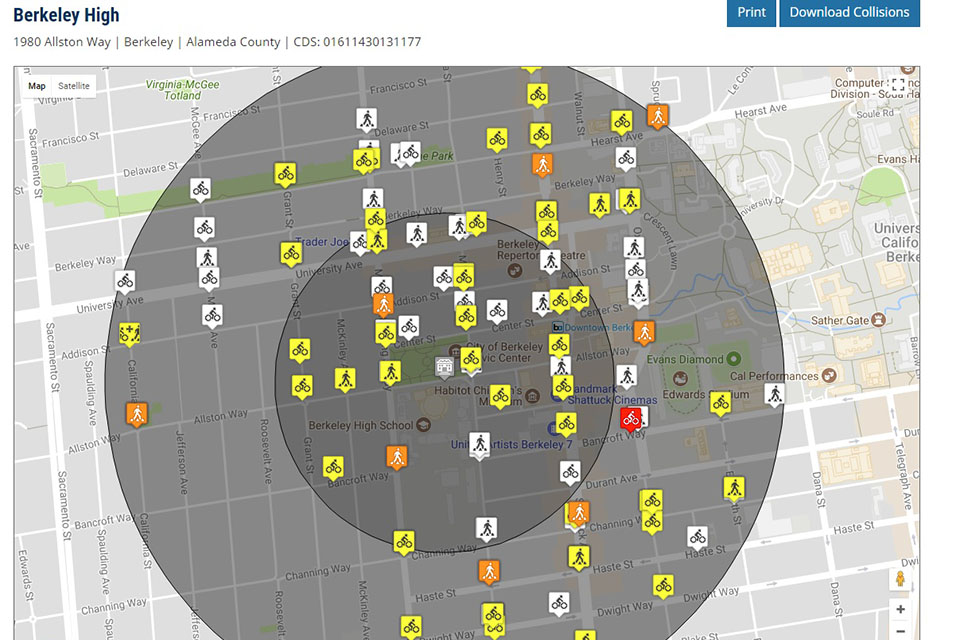
Safe Routes to School Map
Provide a pedestrian and bicycle crash map within half mile radius of public schools in California.
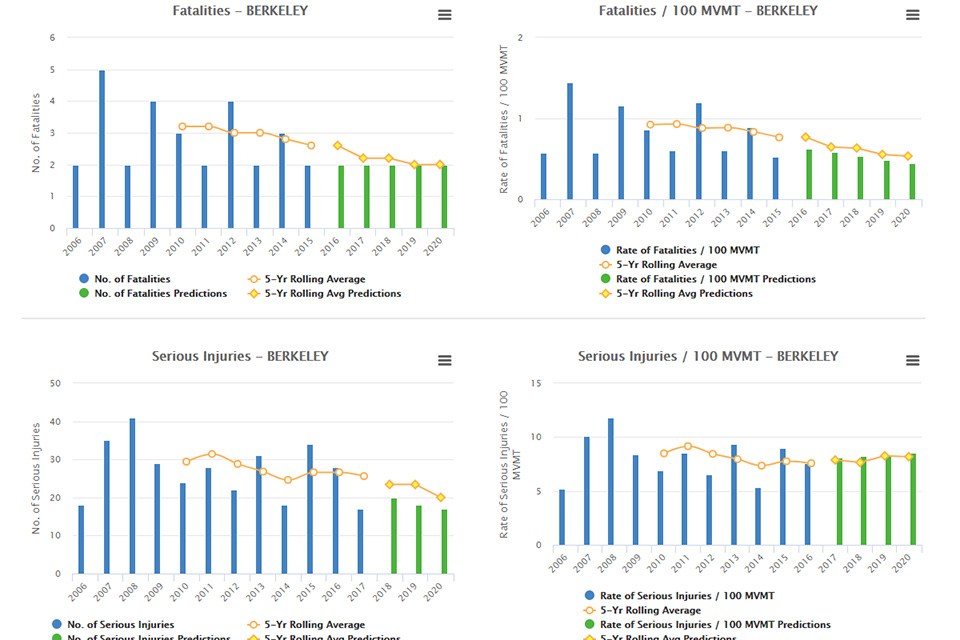
Safety Performance Measure Target Setting
Support California Safety Performance Management (Safety PM) Target Setting for statewide, MPOs, counties and cities based on FARS, SWITRS, and HPMS data.
ATP Maps & Summary Data
Utilize multiple crash maps to find pedestrian and bicycle crashes hot spot and generate data summaries within specified project and/or community limits.
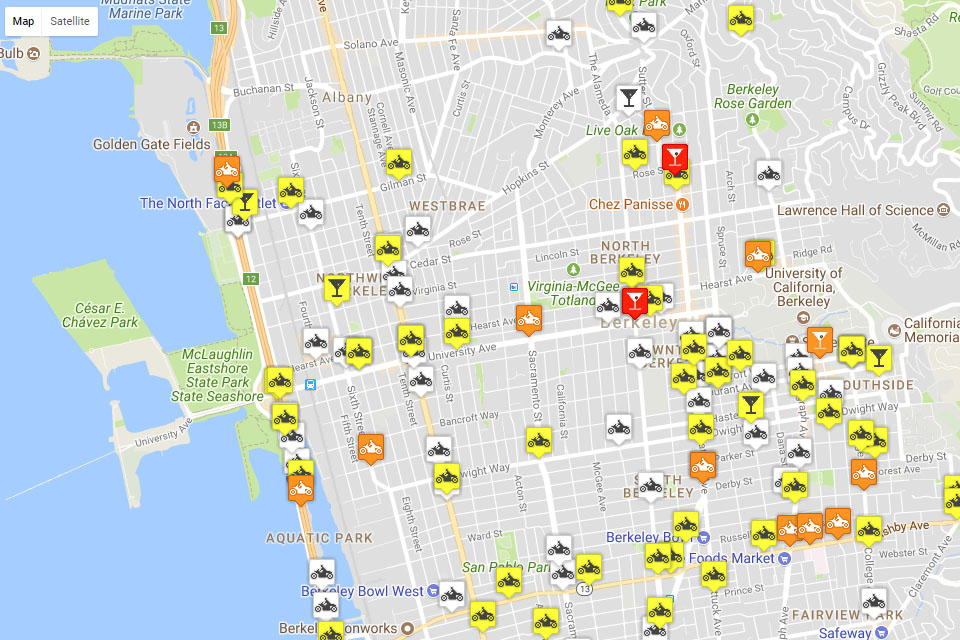
Motorcycle Crash Map
Provide a simple means to explore motorcycle crashes in California by selected county and/or city.